Latest News
All-hands Meeting
The NSF EPSCoR RII Symposium took place on Monday, May 11, 2009 in Baton Rouge, Louisiana. The symposium featured four 'anchor' presentations on CyberTools/Science Driver interactions, a poster competition, an outreach/education session, and plenty of opportunities for networking. Find the Symposium's presentations and posters here.
[Other News]
Image Information
The following images are used for the research modules. You can click on the image to see a larger version of it.
Cactus Black Hole Interactive Tutorial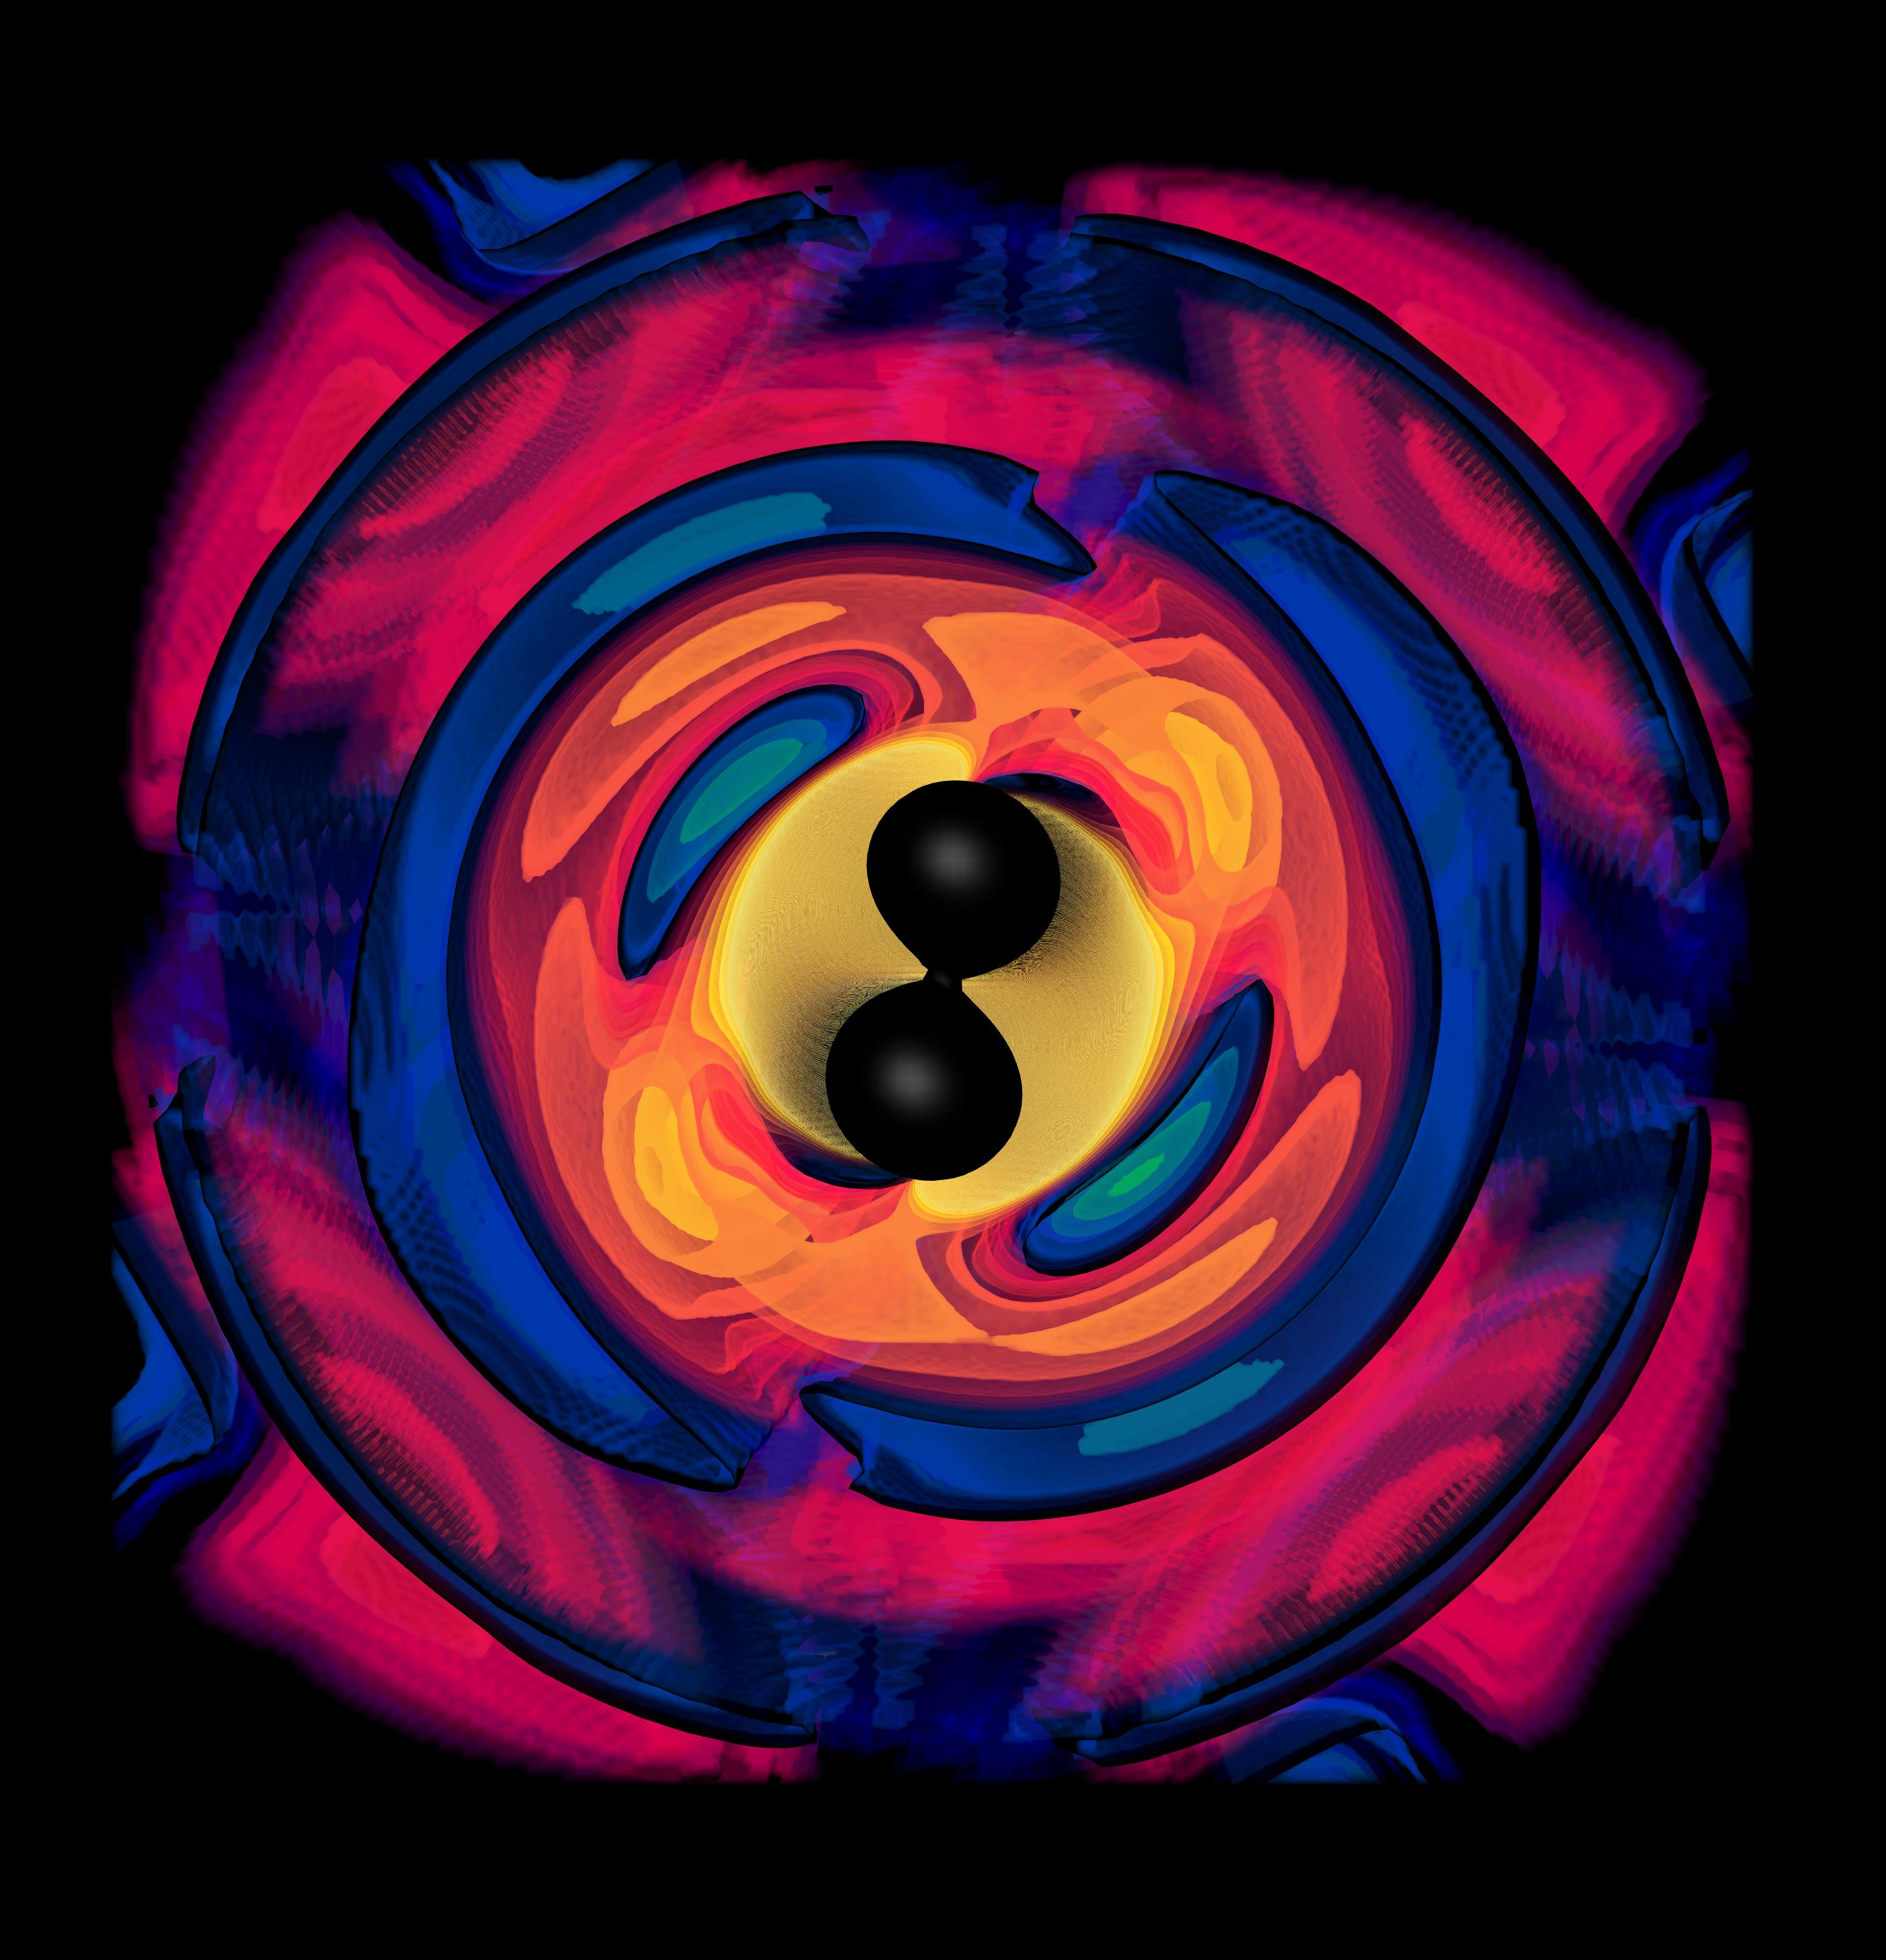
The image displays a snapshot of a simulation of inspiralling and merging binary black holes. The black figure-eight shaped object in the center of the image are the two black holes that have begun to merge. The yellow-red-blue coloured background shows the structure of the gravitational waves in the equatorial plane that have been created during the simulation; yellow corresponds to wave crests and blue to wave troughs. After merging, the two black holes will oscillate (similar to merging drops of water) for a short time, and then reach a stationary end state. This image is courtesy of the Max Planck Institute for Gravitational Physics (Albert Einstein Institute)/Zuse Institute Berlin/Center for Computation & Technology at Louisiana State University. Visualization by Werner Benger, numerical simulation by Peter Diener. Publication of this image requires proper credits and written permission. Please contact werner -at- cct.lsu.edu and diener -at- cct.lsu.edu in advance of publication. |
Links: Cactus Toolkit, Numerical Relativity Group at LSU, at AEI. |
SAGA Tutorial
Although Grid technologies have matured considerably over the past few years, applications that can effectively utilize these technologies are far from ubiquitous. A key impediment in the accelerated development and deployment of Grid applications is the scarcity of high-level application programming abstractions that bridges the divide between the needs of Grid applications and the capabilities offered by middleware. The lack of such application-level programming abstractions is compounded by the fact that there exist incompatible and often changing Grid middleware systems in both research and production environments. The goal of a simple programmatic interface that is widely adopted, usable and available, is to provide a 'Grid counterpart to MPI' (at least in impact if not in details) and that would supply developers with a simple, uniform, and standard programmatic interface with which to develop distributed applications. This Grid, and more generally stated, this 'Distributed counterpart to MPI' now exists--the Simple API for Grid Applications (SAGA). |
Links: SAGA. |
Image Classification Tool Tutorial
|
Protein Data Integration Tool Tutorial
|
Computational Fluid Dynamics Toolkit Tutorial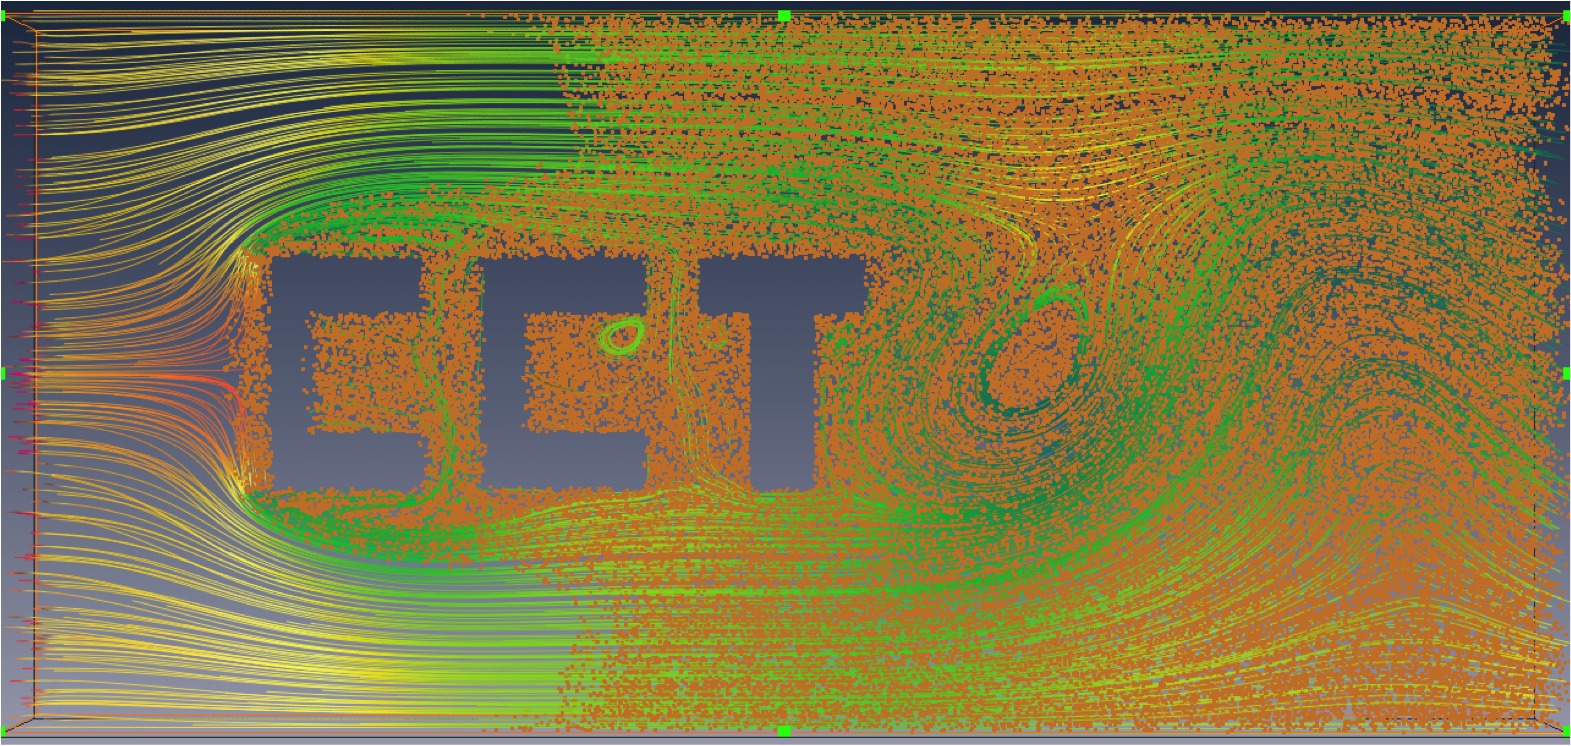
|
Vish Tutorial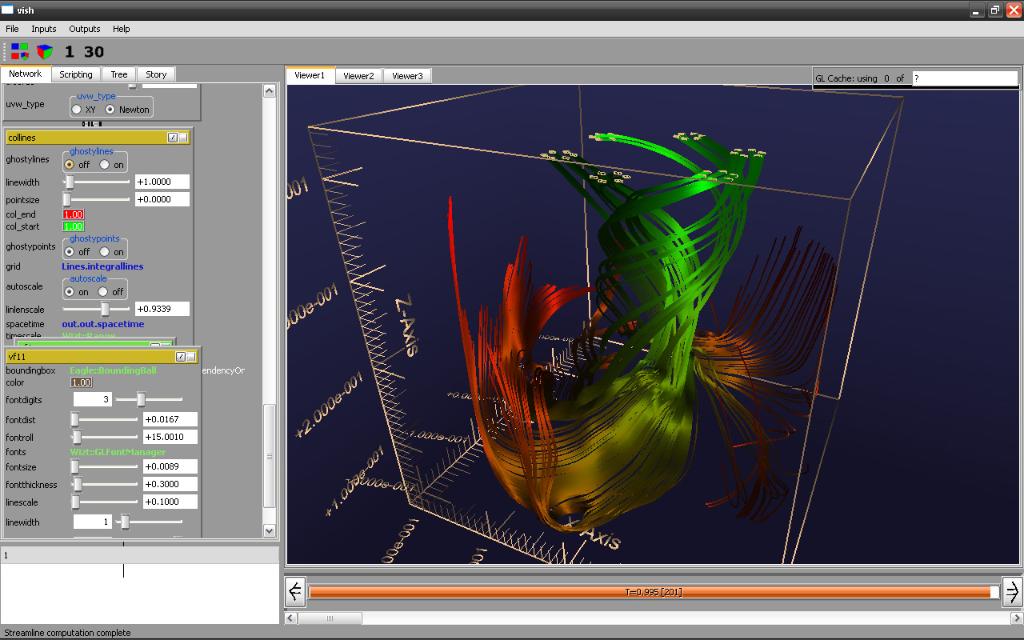
Vish is a software enviroment for implementing visualization algorithms. It was brought to the CCT by its main author Dr. Werner Benger as prior invention based on eight years experience in writing software for scientific visualization. Vish is adapted and expanded to the various diverse needs of the Scientific Visualization group in order to cover all aspects within the same environment with full availability of the source code. |
Links: Vish. |